PTE Academic · Speaking
PTE Describe Image
You look at an image for 25 seconds. Then you talk about it for 40.
A chart, a map or a photo comes up on the screen, and you describe it out loud. There is only one try. The good news is that you do not need clever words for this task. You need to say the main things the image shows, and to keep talking without long pauses.
How the task works
Three moments, and they go fast
There is no extra time to read and no second try. Almost everything depends on the plan you make while you are looking at the image.
Look at the image
The image appears and the clock starts. Ask yourself three questions: what is this about, what is the biggest and the smallest, and what changes. Then choose your first sentence.
Speak
The recording starts by itself — you do not press anything. Say what the image is, give the main details, and finish with one sentence that sums it up.
Silence ends it
If you stop talking for three seconds, the recording closes — even if you have not said anything yet. So start speaking straight away, even slowly.
How Pearson scores it
Three things are marked, not one
Your answer is not simply right or wrong. The computer marks three things at the same time, and an expert also reviews Content, so you can be strong in one of them and still lose marks in another.
Content
How much of the image you really talk about: what it shows, the main features, the biggest and smallest values, and how they compare. Meaning is what counts — a sentence with a small mistake still earns the point if the idea is clear.
Oral Fluency
How smoothly you speak: an even speed, whole phrases, no long pauses and no "um". Stopping in the middle of a sentence, or running out of time before the end, costs you marks here.
Pronunciation
How easy you are to understand. You do not need a British or an American accent. You need sounds and word stress that a listener can follow without effort.
Grammar is not marked as a separate trait in this task, and the range of words you use is part of Content. Here only these three count, and you can still earn part of the marks if your answer is not complete. The marking is done by computer, with an expert also reviewing Content, and this task counts towards your Speaking score.
What usually goes wrong
Where students lose marks
You never finish
If you describe every bar in order, the time runs out before your last sentence. Keep room to say how the main features relate.
An opening that says nothing
"This image gives us information about…" is only a frame. If no fact from the image comes after it, those seconds earn you nothing.
Reading out every number
Middle numbers cost you seconds and add very little. Say the biggest, the smallest, and anything that looks unusual.
Freezing at the start
A long pause at the beginning hurts you twice: you lose speaking time, and the recording can close on you. Have one first sentence ready that works for any image.
A worked example
One image, and what a good answer says
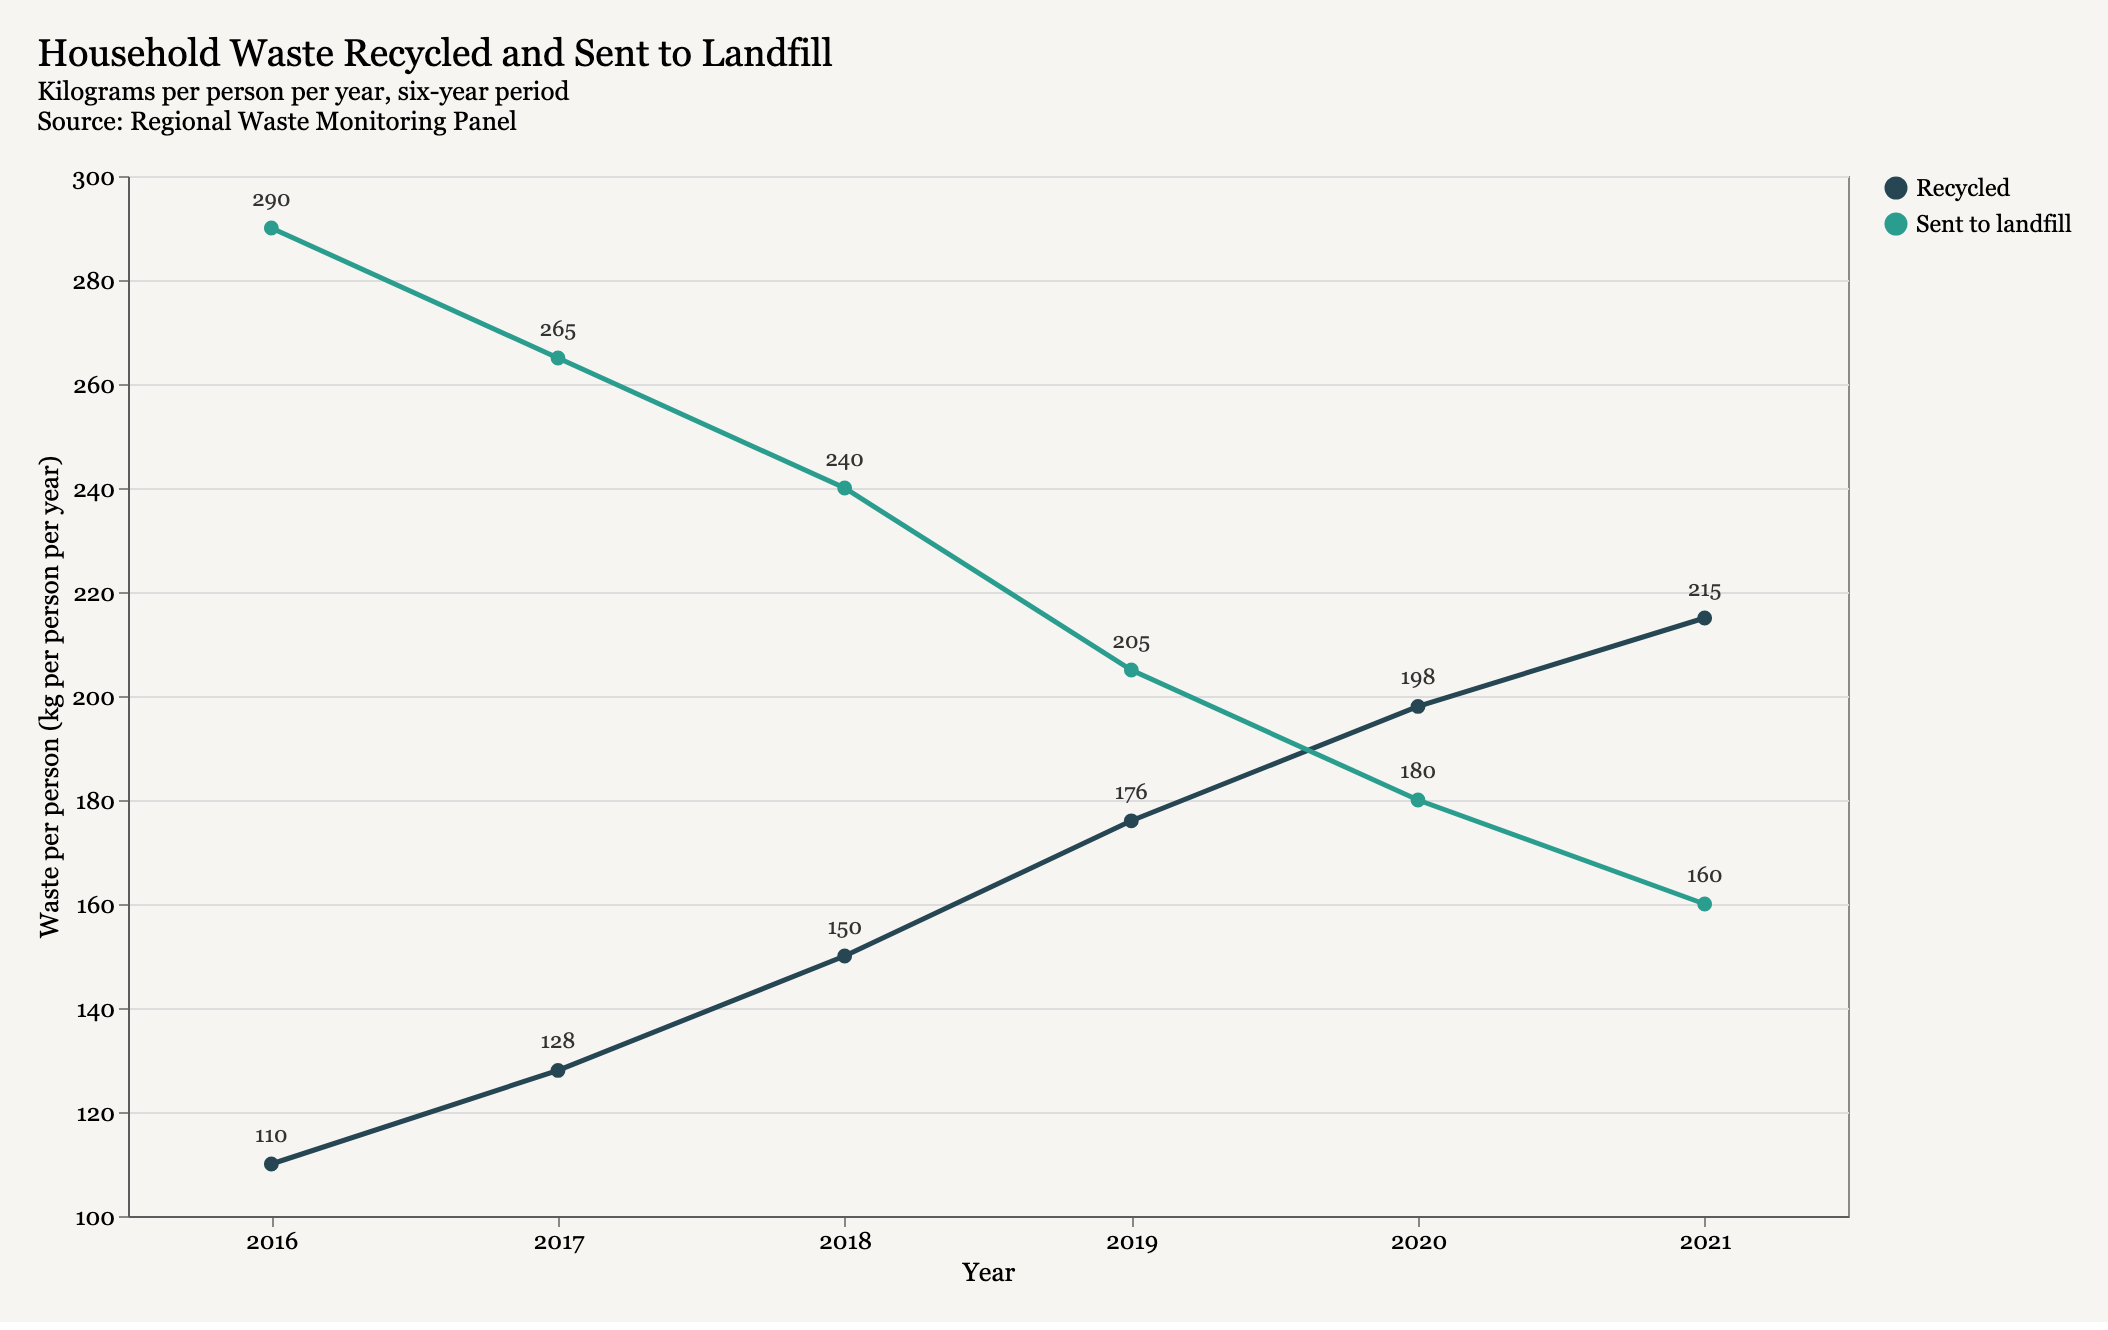
Here is a real image from our practice. Look at it, decide what you would say in 40 seconds, and then compare with the list below.
What a good answer says
- Overview What the graph shows Household waste recycled and sent to landfill, in kilograms per person per year, from 2016 to 2021.
- Trend Recycling goes up The recycled line rises steadily, from 110 kilograms in 2016 to 215 in 2021.
- Trend Landfill goes down The sent-to-landfill line falls steadily, from 290 kilograms to 160.
- Relationship The lines cross They cross between 2019 and 2020, where recycling becomes the larger of the two.
- Value The steepest fall Landfill falls fastest between 2018 and 2019, from 240 kilograms to 205.
- Value The widest gap The gap is widest at the start: in 2016 landfill is more than twice recycling, 290 kilograms against 110.
- Conclusion The change overall By the end the two lines have swapped places, and recycling has replaced landfill as the larger share.
What a full answer sounds like
This line graph shows household waste recycled and sent to landfill, in kilograms per person per year, from 2016 to 2021. The recycled line rises steadily from 110 kilograms to 215, while the sent-to-landfill line falls steadily from 290 to 160. Landfill falls fastest between 2018 and 2019, and the gap between the two lines is widest at the start, where landfill is more than twice recycling. The lines cross between 2019 and 2020, when recycling becomes the larger of the two. Overall, the two lines have swapped places by the end, with recycling replacing landfill as the larger share.
Strategy tip: Describe the direction of each line first, and only then say where they cross. Do not read the numbers one by one.
Look at the shape of that list: one sentence about what the image is, the direction of each line, how they compare, two numbers worth saying, and a conclusion. The overview and the comparison are worth the most; extra numbers add the least.
Practising here
Feedback that tells you why, not just a number
You record your answer with the same clock as the exam. Then you find out what worked, what was missing, and what to try on the next image.
The same clock as the exam
The time to look, the recording that starts by itself, and the silence that ends your answer — the same rules the test uses, so practice feels like the real thing.
Marked the way the exam marks it
You get a separate result for each thing we mark, not one number, so you can see which one is holding your score down.
Every point, named
After you speak, you see the key points from the image one by one: the ones you said and the ones you missed.
An example answer for every image
A full answer written for that image and fitted into the time, so you can hear what a complete answer sounds like.
One tip you can use next time
A short piece of advice about how to speak on the next image — not your score again in different words.
Common questions
Describe Image, answered
How long do I get for Describe Image?
You get 25 seconds to look at the image and 40 seconds to speak. The recording starts by itself, and here you cannot pause it or record your answer again.
What happens if I stay silent?
Three seconds of silence close the recording, even at the very beginning. If your mind goes blank, say what the image is about — any true sentence is better than a pause.
What kinds of image can appear?
Bar charts, line graphs, pie charts, tables, maps and sometimes a photo. Each kind needs something different from you: a line graph needs directions, a pie chart needs the largest and smallest shares, a map needs places.
What if I do not understand the image?
Start with what you can see: the title, the units, the years, the biggest and the smallest value. You do not have to explain why anything happens. Describing what is there is enough.
How is Describe Image scored?
By computer, on three things: Content, Oral Fluency and Pronunciation, with an expert also reviewing Content. One image is not pass or fail — you can earn part of the marks, and all your speaking tasks together make your Speaking score.
Does grammar or vocabulary count?
Not as a separate mark. The range of words you use is part of Content, and a small grammar mistake will not cost you here, as long as the listener still understands your point.
How many Describe Image items are in the test?
Usually five or six, in the Speaking part, one after another. The same plan has to work every time, which is why a first sentence you can say on any image helps so much.
How do I practise Describe Image here?
Sign in, open Describe Image and record a real answer with the exam clock running. You get the points you covered, the points you missed, an example answer for that image, and one tip to use next time.
Try it with the real clock
Record one answer, see which points you got and which you missed, and take the tip into the next image.